

Surge Reports: Pipedrive reporting with forecast, deal risk and activity per rep
Dashboards on top of Pipedrive that each answer one question, from the same numbers for the whole team.
- Forecast by close monthWhat lands this month and this quarter?
- Deal riskWhich open deals have no next activity or have gone quiet?
- Funnel healthWhere do deals drop out between first contact and won?
- Activity per repWho calls, emails and schedules enough to keep their pipeline full?
- Solves
- Your question runs across deals, activities and contacts at once, and Pipedrive builds a separate report per kind of data.
- Who it is for
- Teams with several Pipedrive sources or questions that cross objects
- Price
- From€100per monthEvery package free for 14 daysAll prices exclude VAT.
- Works with
- Pipedrive, Several Pipedrive environments, Other data sources
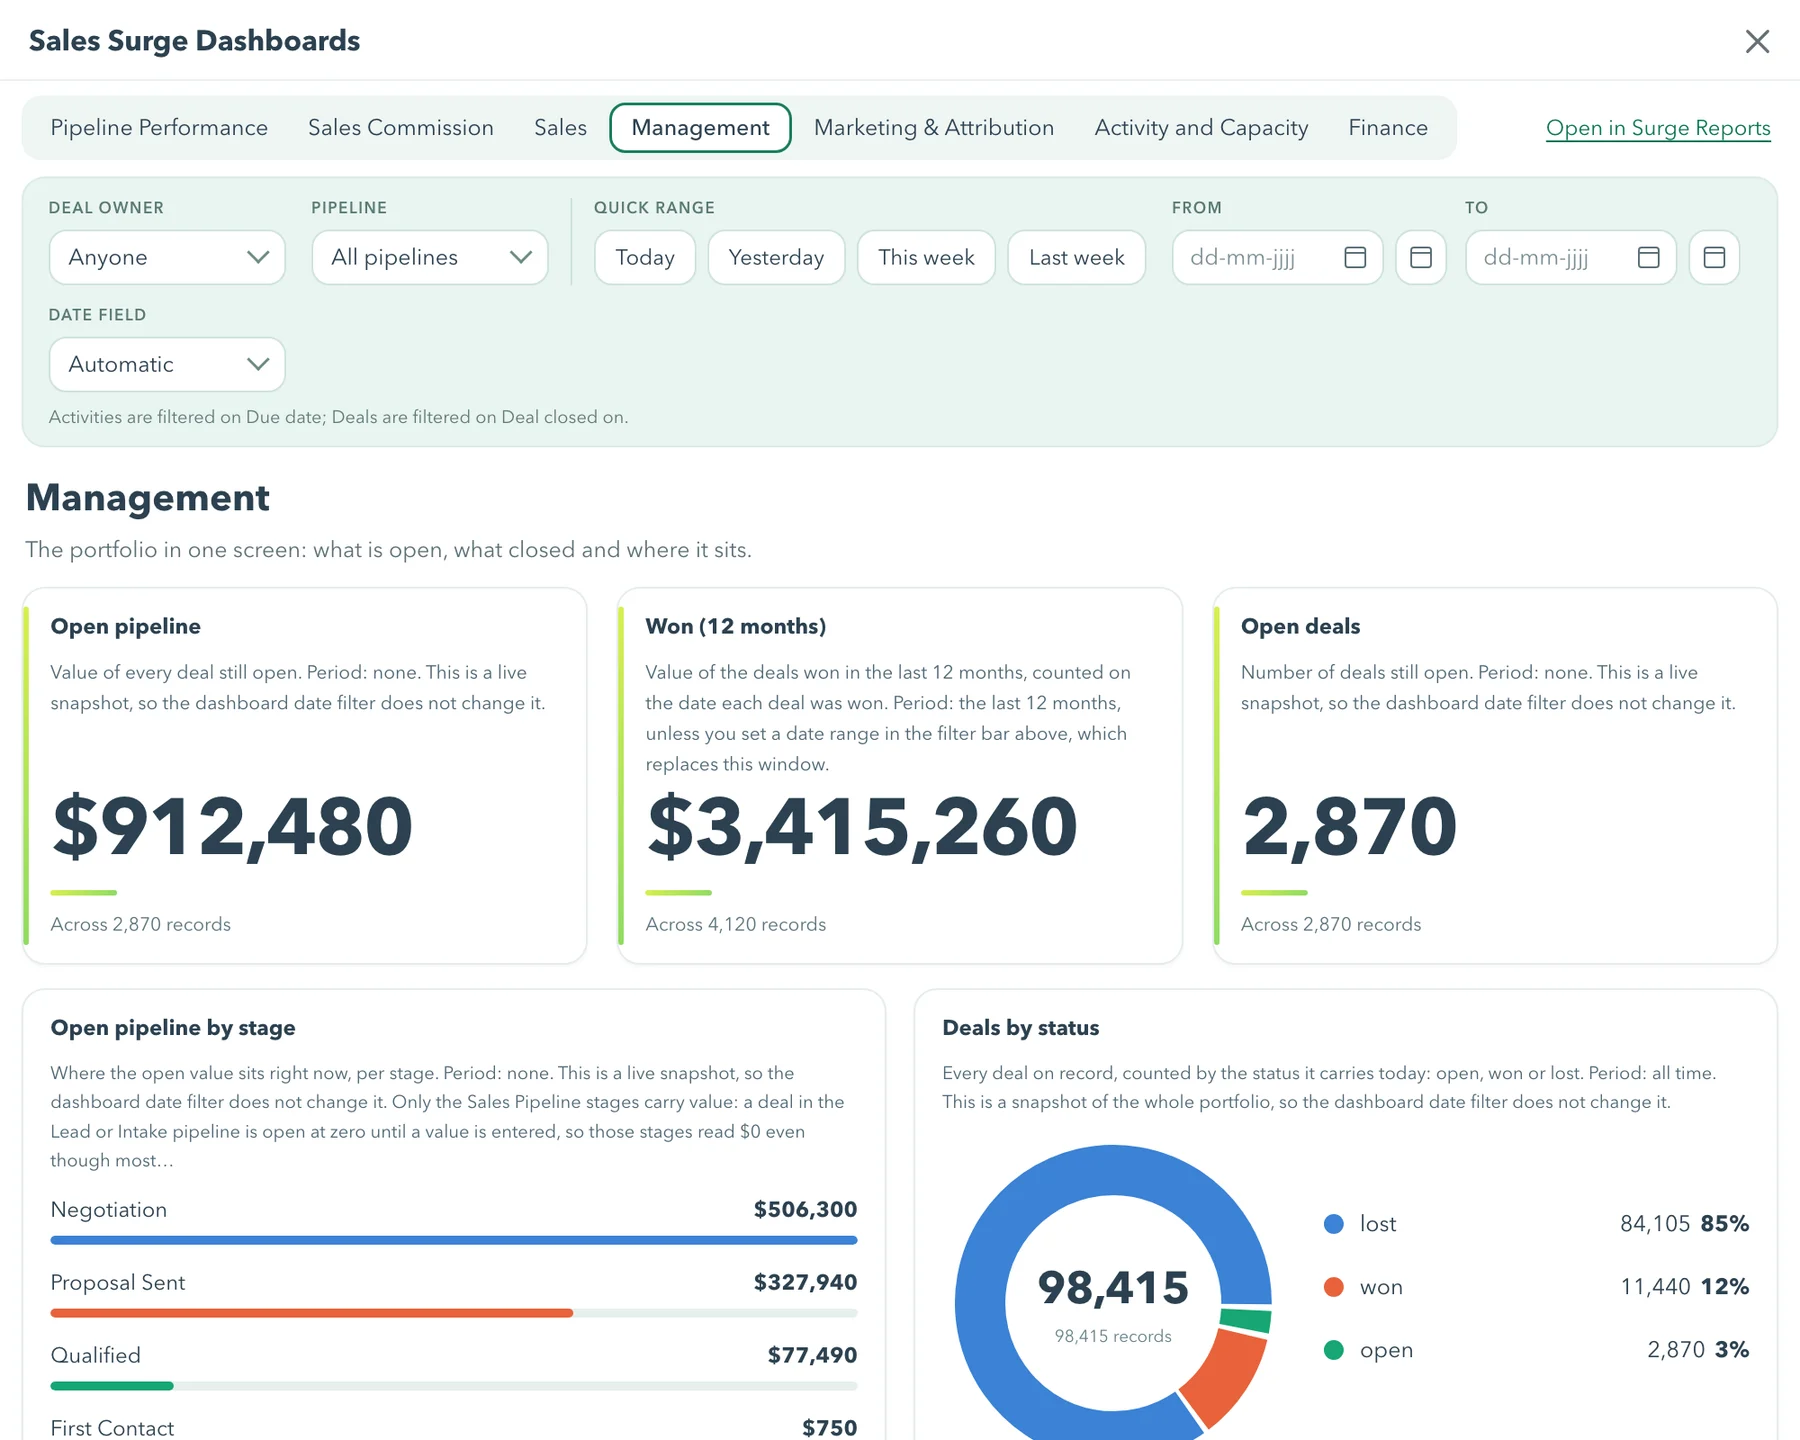
What it does
Reporting across objects
One view across deals, activities, contacts and products. Pipedrive does not do that on its own.
Several sources, one view
Several Pipedrive environments and other sources come together, cleanly separated per client.
One rule per KPI
The same definition everywhere, so numbers stay comparable between teams.
Who it is not for
One Pipedrive environment with twenty deals a month. Native Pipedrive reporting covers that, and you would pay here for nothing.
Built for Pipedrive

Built by a Pipedrive Platinum Partner, top 8 worldwide since July 2026.
What it costs
What it costs
- Plan: Basic, up to 5 dashboardsPrice: €100 per month
- Plan: Growth, up to 8 dashboardsPrice: €150 per month
- Plan: Unlimited dashboardsPrice: €250 per month
In short
Surge Reports is a reporting layer on top of Pipedrive. It pulls in several sources and reports across objects, which native Pipedrive cannot do. So you see deals, activities, contacts and products in one view, with dashboards for funnel health, deal risk and forecast. The numbers update as your CRM changes. Packages from 100 euros a month, each free for 14 days.
Source: Sales Surge, product information November 2026
What can Surge Reports do that Pipedrive Insights cannot?
Surge Reports works across objects and accounts. Pipedrive Insights builds each report from one main object, such as deals or activities, inside one account. For plenty of teams that is enough, and then you should simply use it. Insights comes with your plan, reports are quick to set up and goals per rep work well.
The gap shows up in questions that cross those lines. How many activities did a won deal take on average? Which products does each team sell, and at which stage do those deals stall? What does the pipeline look like with three Pipedrive accounts side by side? In Pipedrive alone, those need exports and a spreadsheet. At the time of writing, the comparison looks like this:
| Question | Pipedrive Insights | Surge Reports |
|---|---|---|
| Report on one object (deals, activities) | Yes, and well | Yes |
| Combine deals with activities, contacts and products | Limited | Yes, in one view |
| Several Pipedrive accounts in one view | No | Yes, separated per client |
| Other data sources alongside | No | Yes |
| One KPI definition for every team | Set per report | One rule, the same everywhere |
| Included in your Pipedrive plan | Yes | No, from 100 euros a month |
One account and questions about one object? Stay in Insights. Surge Reports starts to pay off once you have several sources, or questions that run across objects.
Which reports do you get in Surge Reports?
You get dashboards that each answer one question. How many you can use depends on your package: up to 5, up to 8 or unlimited. These are the ones teams open most:
- Funnel health. Where do deals drop out between first contact and won?
- Time in stage. Which stage holds deals the longest, and for whom?
- Deal risk. Which open deals have no next activity or have gone quiet?
- Forecast by close month and by stage. What lands this month and this quarter if the stage probabilities hold?
- Activity per rep. Who calls, emails and schedules enough to keep their pipeline full?
- Product revenue. Which products carry the revenue, per team and per period?
- Lead volume and source. How many leads come in, and from where?
Every report drills down from portfolio to team to a single rep. A manager sees the total and a rep sees their own numbers, from the same rule.
How do you define a KPI once?
You set the calculation once in Surge Reports, and every dashboard uses it. Sales counts a deal as won at signature, finance at the first invoice. The monthly meeting then has two numbers for the same month, and the discussion is about which one is right instead of about the deals.
We start from the KPI set we use in every project:
- Lead to first contact time
- Lead to deal cycle time
- Conversion rate per pipeline stage
- Response time on new leads
For each KPI we write down what counts, from which moment and from which field. To compare the definitions yourself first, read the RevOps KPI glossary.
Surge Reports or the revenue dashboards service: what is the difference?
Surge Reports is the product: you connect Pipedrive, pick a package and work with the dashboards it includes. The revenue dashboards service is a project in which we build dashboards for you, around your own KPIs and sources.
Pick the product when your questions fit the standard dashboards. Pick the service when you first need to work out what to measure, or when the data sits in systems that are not connected yet. Often it runs in that order: the service first to fix definitions and integrations, then Surge Reports to keep track.
Why clean data comes first
A dashboard is only as good as the data underneath. With duplicate organisations in Pipedrive, your forecast counts the same deal twice and conversion per stage stops adding up. Clean that up first with Surge Dedupe.
If the pipeline itself is off, with stages nobody uses or deals that never close, then fixing your sales pipeline is the first step. Reporting on a broken pipeline only gives you neat charts of the wrong numbers.
Questions we often get
Short answers. Anything else, ask us directly.
Does Surge Reports work with a CRM other than Pipedrive?
No. Every Surge product works with Pipedrive only. You can add other sources, such as a second Pipedrive account or a data source alongside it, but Pipedrive is always the base. If you work in HubSpot or Zoho, we build reporting through our revenue dashboards service instead.
How fast do the numbers update?
The numbers update as soon as something changes in your CRM, because Pipedrive notifies Surge Reports of every change. Mark a deal as won at 10 o'clock and the dashboard counts it from then on, without anyone running an export. On top of that, a scheduled check removes records you deleted in Pipedrive from the reports as well.
Can I combine several Pipedrive accounts?
Yes. That is one of the reasons Surge Reports exists. You connect several Pipedrive accounts and see them in one view, or each on its own. The data stays separated per client, so an agency running Pipedrive for several clients never mixes one client's numbers with another's.
Who can see the dashboards?
Everyone you invite to your workspace, and nobody else. You decide who gets access. Each workspace is separated from other clients, so what you connect is visible to you and your team only. A rep can click from the team total down to their own numbers, calculated with the same rule.
Can I export to Excel?
Not by default on every dashboard. Where a team needs a fixed export, for a month-end close for example, we build in an export per tile. If you need one, mention it at the start and we check whether it fits your package. The idea is still that you read the number in Surge Reports, not in a spreadsheet.
What happens to my workspace after the 14 days?
If you do not pick a package, the dashboards and the data behind them are locked. Your workspace, your team members and your Pipedrive connection stay in place. So you can still see who has access and what a package costs, and you can pick one whenever you are ready. After that you carry on with what you set up during the trial.
Can I try it first?
Yes, free for 14 days on your own Pipedrive data. You connect Pipedrive through the app at insights.sales-surge.io and see your own pipeline straight away. During the trial you get the room of the smallest package. What the three packages cost and how many dashboards each includes is in the pricing block above.
See your pipeline in one view.
Try Surge Reports free for 14 days on your own Pipedrive data.